*** Disclaimer: For Education and Entertainment purpose only – @yakBro
“If you are not willing to learn, no one can help you. If you are determined to learn, no one can stop you.”
Zig Ziglar
The scripts are based on trading setups from (Stockbee)@PradeepBondeand @Qullamaggie
My only goal here, is to share and help with the thinkscripts. That’s all. Your only job is, to study hard, understand the market structure and find the profitable patterns. For more information about theirs setups, go to https://stockbee.blogspot.com and https://qullamaggie.com watch Kristjan youtube videos.
(Study, understand, test, re-test, test-again, change it little… and develop your Own System.)
3 parts :
- Studies / Indicators / Labels –
- Use these indicator to learn how stocks moves (ebb/flow, expansion/contraction, market structure, etc)
- Scanners –
- Use the Scanner to find the highest gainer/loser stocks within a certain period. (and you wait for patterns to setups)
- Use the scanner to find the tight range stocks for anticipate BO plays.
- Custom Watchlist Quotes –
- Use it to sort the highest gainer/loser(5days,1month…), ADR, Rvol, IBD RS,etc.
**Bonus: 1. Advance Scanner/Alerts and 2. Trading System with Risk Management inspired by @Qullamaggie
Note: Visit here to learn how to on TOS https://yakbro.com/instructions-on-downloads/
1. STUDIES
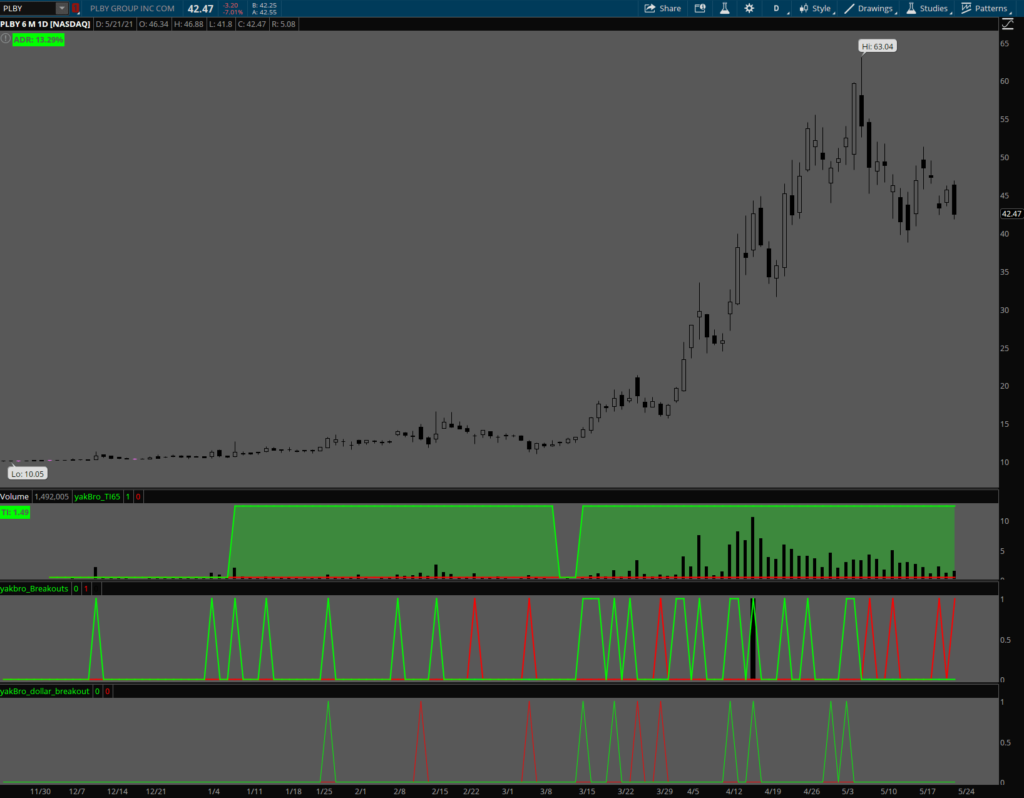

- TI65 – Use to check Bullish/Bearish Trend Intensity 65 days
#TI65

declare lower;
def sma7 = average(close,7);
def sma65 = average(close,65);
def Value = sma7/sma65;

#bullish
plot Bullish = Value >=1.05 ;
Bullish.setDefaultColor(color.green);
addcloud(Bullish,0,color.green);

#Bearish
plot Bearish = Value <=.95;
Bearish.setDefaultColor(color.red);
addCloud(Bearish,0,color.red);

## labels
addlabel(yes,"TI: "+round(value),if bullish then color.green else if bearish then color.red else color.white);
2. 4% Breakout up/down and 9mil Volume BO up/Down studies
declare lower;

##1.   4% Break Out UP or 4% Break Out Down
def change = close/close[1];
#checks if current Volume > previous bar and minimum 100k Volume
def validVolume =  volume>volume[1] and volume>100000;

#UP
# Gain 4% and Volume condition is valid
plot BOU = change >1.04 and validVolume;
BOU.setDefaultColor(color.green);

#DOWN
# lost 4% and Volume condition is valid
plot BOD = change <.96 and validVolume;
BOD.setDefaultColor(color.red);

##2. Break Out 4% +/- with 9Mil Volume
# volume above 9mil and 4% up or down
plot Dollar9mil = volume >9000000 and (BOU or BOD);
Dollar9mil.setPaintingStrategy(paintingStrategy.HISTOGRAM);
Dollar9mil.setDefaultColor(color.black);
3. Dollar BO UP/Down studies – It only plots if previous day range was under 90 cent and today range is above 90 cent. Its mainly for high price stocks.
###start
declare lower;

##  Dollar breakout
def DollarChange = close-open;
#checks if current Volume > previous bar and minimum 100k Volume
def validVolume =  volume>volume[1] and volume>100000;
def previousDayTightRangeCheck = absValue(close[1]-open[1])<.90;

#UP
# UP 90 cent
plot dollarBOU = previousDayTightRangeCheck and DollarChange > .90 and validVolume;
dollarBOU.setDefaultColor(color.green);

#DOWN
# down 90 cent
plot dollarBOD = previousDayTightRangeCheck and DollarChange < -.90 and validVolume;
dollarBOD.setDefaultColor(color.red);
4. EP studies – 4% up and with 3times 50day average volume and volume is above 3million volume. Your can always test with different inputs.
# Episodic Pivots (EP)

declare lower;

def ADV = Average(volume,50); #average 50 day volume

#4% beakout and volume above 3*ADV and volume above 3million
def EP = close/close[1]>=1.04 and volume>3*ADV and Volume > 3000000;;

plot scan = EP;
scan.setDefaultColor(color.magenta);
5. ADR – Average Daily Range
input length = 20;
input adrMin = 5; #eg: if 5% is minimum for me
input showLabel = yes;
def range = (high(period = AggregationPeriod.DAY)/low(period = AggregationPeriod.DAY)-1);
def ADR =  Average(range, length);

#label
addlabel(showlabel,"ADR: " + aspercent(ADR),if ADR >= adrMin/100 then color.green else color.red);
6. Combo studies (4%BO,$ BOs, 9 million and EP BO) – combined all into one scripts
## everything on on Scripts

declare lower;
def change = close/close[1];

def ADV = Average(volume,50); #average 50 day volume

#4% breakout and volume above 3*ADV and volume above 3million
plot EP = change[1]>=1.04 and volume>3*ADV and Volume > 3000000;;
EP.setDefaultColor(color.magenta);

#checks if current Volume > previous bar and minimum 100k Volume
def validVolume =  volume>volume[1] and volume>100000;

#Gain 4% and Volume condition is valid
plot BOU = change >1.04 and validVolume;
BOU.setDefaultColor(color.green);

#DOWN
# lost 4% and Volume condition is valid
plot BOD = change <.96 and validVolume;
BOD.setDefaultColor(color.red);

##9Mil Volume
# volume above 9mil and 4% up or down
plot Dollar9mil = volume >9000000 and (BOU or BOD);
Dollar9mil.setPaintingStrategy(paintingStrategy.HISTOGRAM);
Dollar9mil.setDefaultColor(color.black);
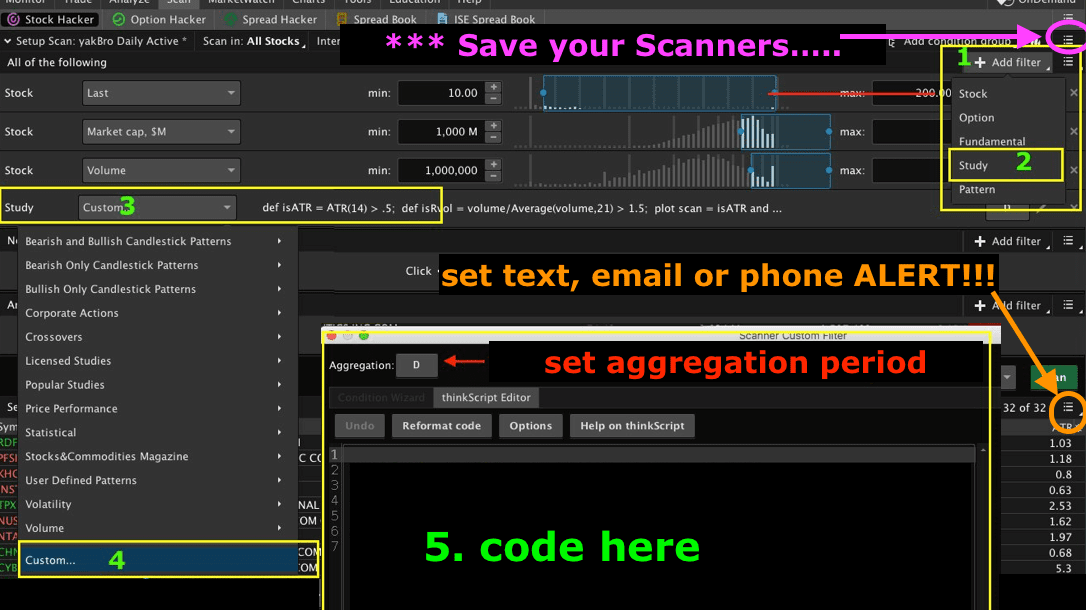
2. Scanners
Note: for easy access, Save each scan with different names like 4% BO, 4% BD, 9mil BO and 9mil BD,etc.
- Breakouts (4% up/down and 9million shares Up/Down)
# 4% Break Out UP/Down and 9 mil volume BO
def change = close/close[1];
def validVolume =  volume>volume[1] and volume>100000;
def Dollar9mil = volume >= 9000000;
def BOU = change >1.04 and validVolume;
def BOD = change <.96 and validVolume;

### scanners select by removing '#' from scan

#1.  4% UP
#plot Scan = BOU;

#2.  4% Down
#plot Scan = BOD;

#3. 9mil Volume + 4% up
plot Scan = Dollar9mil and BOU;

#4. 9mil Volume + 4% Down
#plot Scan = Dollar9mil and BOD;
2. Dollar breakout or breakdown (Good for morning BO trade)
## (this is mainly for high priced stocks)

def DollarChange = close-open;
def validVolume =  volume>100000;
def PDtightCheck = absValue(close[1]-open[1])<.90;

### scanners seleclt by removing '#' from

#1. UP 90 cent
plot Scan_dollarUP = PDtightCheck and DollarChange > .90 and validVolume;


#2. DOWN 90 cent
#plot Scan_dollarDOWN = PDtightCheck and DollarChange < -.90 and validVolume;
3. TI scanner (Bullish / bearish )
### TI scanner

def sma7 = average(close,7);
def sma65 = average(close,65);
def Value = sma7/sma65;

#select scanners by removing '#'

#bullish
plot  scan = Value >=1.05 ;

#bearish
#plot scan  = Value <=.95;
4. ADR + Dollar Volume (Liquidity + Volatility Scanner Check) note: can also go with ATR instead of ADR.
###check for liquidity and volatility
#ADR scanners and dollar volume check

input length = 20;
input adrMin = 5; # minimum adr percentage required.
input DollarMin = 20; # in millions (dollar required)

#adr check
def range = (high/low-1);
def CheckADR =  Average(range, length) >= adrMin/100;

#scan dollar volume
def CheckDollarVolume = close*volume >= Dollarmin*1000000;

#scanner check ADR and DollarVolume
plot scan = CheckADR and checkDollarVolume;
5. Strong % Gainer Scanners (5days, 1month,3months, 6months, 1 year…)
Use this to find top gainers within prefer time period.
# remove '#' from scan

# 20% up in 1 week
#plot scan = close/close[5] > 1.2;

# 20% up in 1 month
#plot scan = close/close[21] > 1.2;

# 50% up in 1 month
#plot scan = close/close[21] > 1.5;

# 100% up in 3 month
#plot scan = close/close[63] > 2;

# 100% up in 6 month
plot scan = close/close[126] > 2;

# 200% up in 1 year
#plot scan = close/close[252] > 3;
6. Narrow / Tight Ranges (6 different conditions)
#scan tight ranges / narrow range

def ATR = ATR(14);
def range = (high-low);

#conditions
#1. inside bar candle
def insideBar = high<=high[1] and low>=low[1];

#2. double Inside Bar
def doubleInsideBar = insidebar and insidebar[1];

#3. triple Inside Bar
def TripleInsideBar = insidebar and insidebar[1] and insideBar[2];

#4. price change < = 1%
def tightPrice = absvalue(close/close[1]-1)*100 <= 1;

#5. tight range - last bar is under 50% of ATR)
def tightRange = range <= ATR*.5;

#6. last 3bars are under 50% of ATR
def tightRange3 = highest(range,3)<= ATR*.5;


### choose by removing '#' infront of plot scan.

#plot scan = insideBar;
#plot scan = doubleInsideBar;
plot scan = TripleInsideBar;
#plot scan = tightPrice;
#plot scan = tightRange;
#plot scan = tightRange3;

### *** you can also select multiple conditions... like below

#plot scan = tightRange3 and tripleInsideBar;

#end
7. Combo EOD Bullish (EOD = End Of Day)
#### Bullish combo EOD scanners

def netChange = absvalue(close-open); #find absolute range between open and close.
def Vol = volume;
def PreviousDayTightRange = close[1]/close[2]<=1.02; #previous day change was below 2%

#1. dollarBO today and today netchange is greater than previous day and previos day was tight
def DollarBO = (netchange>=.90  and netchange>netchange[1] and PreviousDayTightRange);

#2. 4%breakout today and volume greather than previous day and previos day was tight
def FourPctBo =(close/close[1]>=1.04 and vol>vol[1] and PreviousDayTightRange);

#3. close above 70% of range
def StrongClose = (close-low)/(high-low)>=.70;

# combine all the conditions + volume and priceabove 3
def BullishCombo = (DollarBO or FourPctBO) and strongClose and vol >= 100000 and close >= 3;

plot scan = BullishCombo;
8. Combo EOD Bearish (EOD = End Of Day)
####Bearish EOD scanners

def netChange = close-open;
def Vol = volume;
def PreviousDayTightRange = close[1]/close[2]<= 1.02; #previous day change was below 2%

#1. dollarBO today and today netchange is greater than previous day and previos day was tight
def DollarBO = (netchange>= -.90  and netchange>netchange[1] and PreviousDayTightRange);

#2. 4%breakout today and volume greather than previous day and previos day was tight
def FourPctBo =(close/close[1]<=.96 and vol>vol[1] and PreviousDayTightRange);

#3. close above 70% of range
def WeakClose = (close-low)/(high-low)<=.30;

# combine all the conditions + volume and priceabove 3
def BearishCombo = (DollarBO or FourPctBO) and WeakClose and vol >= 100000 and close >= 3;

plot scan = BearishCombo;
9. Scan for double from Yearly Low – (or 6 months low & 3 months Low)
# double or 100% up from lows
input Length = 252; #hint: (1 year = 252, 6month = 126, 3 months = 63)

def isValid = close/lowest(low,length)>2;

plot scan = isValid;
3. Custom Quote Tabs
(Hint: 1 year = 252, 6 month = 126, 3 months = 63 and 1 month = 21)

- 1month Gain (Change *length for 3 months, 6 months,1 year …)
input length = 21; #Hint: (1 year = 252, 6 month = 126, 3 months = 63 and 1 month = 21)

plot x = round((close/close[length ]-1)*100,1);
x.assignValueColor(if x>=100 then color.red else if x>=50 then color.green else color.light_gray);
2. TI (Trend Intensity)
#trend intensity
average(close,7)/average(close,65)
3. ADR (Average Daily Range)
def length = 20;
def range = (high/low-1);

plot adr = Average(range, length)*100;
adr.assignValueColor(if adr > 5 then color.green else color.gray);
4. IBD RS
#IBD style RS
plot RS =2* close/close[63] +  close/close[126]+  close/close[189]+ close/close[252];
5. RVOL (Relative Volume)
#Relative Volume

def rVol = volume /Average(volume, 21);

plot x = round(rVol,1);
AssignBackgroundColor(if rVol >= 1 then Color.Dark_red else if rVol >=.5 then Color.orange else Color.black);
**Bonus
- Advance Signal Alerts for watchlist
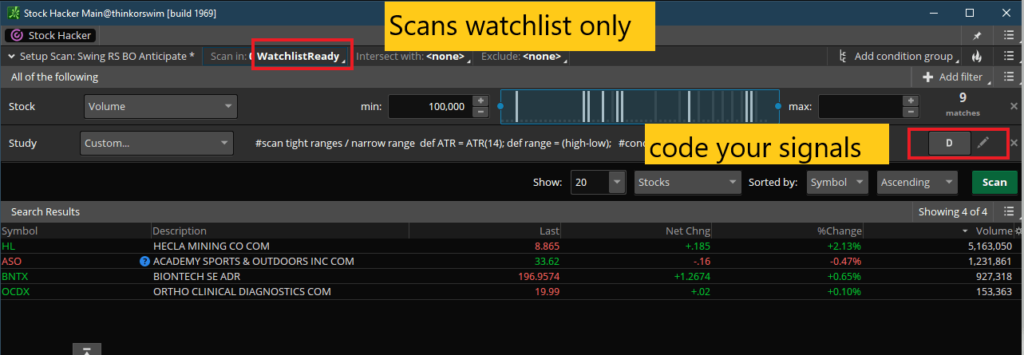
- Create your watchlist of potential stocks; Eg: WatchlistReady
- Load your ‘watchlist“ in [Scan in:]
- Select your criteria (like minimum volume, change…)
- And Custom Signals.
- Anticipate BO Tight Signal
- BO/BD signal
- Save it
- You can also create local alert, email and sms alerts.
Anticipate BO Tight Signal: 4 Signals
#scan tight ranges / narrow range

def ATR = ATR(14);
def range = (high-low);

#conditions
#1. inside bar candle
def insideBar = high<=high[1] and low>=low[1];

#2. double Inside Bar
def doubleInsideBar = insidebar and insidebar[1];

#3. price change < = 1%
def tightPrice = absvalue(close/close[1]-1)*100 <= 1;

#4. tight range - last bar is under 50% of ATR)
def tightRange = range <= ATR*.5;

#choose one or all.
plot scan = insideBar or doubleInsideBar or tightPrice or tightRange;
BO/BD signal: 2 Break out Up/Down signals
#Bo signals

#conditions
#1. break out of previous day high
def BOU = close>high[1];

#2. break Down of previous day low
def BOD = close<low[1];

#remove '#'
# BreakOut
plot scan = BOU;

#BreakDown
#plot Scan = BOD;
2. Swing Trading System with RM


#Hint: Yakbro daily ADR and ATR with Risk Management System 2021
declare upper;

###1. calculate MOvingAverage
input ShortMaLength = 10;
input LongMaLength = 20;
input AverageType = AverageType.Simple;
input ShowMaClouds = yes;
input ShowTrendLabel = yes;

plot Shortma = MovingAverage( averageType = AverageType,Close,shortMaLength);
plot Longma = MovingAverage( averageType = AverageType,Close,LongMaLength);
shortma.setdefaultColor(color.red);
longma.setDefaultColor(color.green);
addcloud(if showMaClouds then shortma else double.NaN,longma,color.green,color.red);
#trend strong UP = close>shortma and short> longma, stong Down = close<shortma and shortma < longma
addlabel(ShowTrendLabel,"Trending: " + if shortma>longma then (if close>shortma then "Strong UP" else "UP") else ( if close<shortma then "Strong Down" else "Down"),if shortma>longma then color.green else color.red);

####2. Calculate ADR and ATR
input ATRlength = 20;
input ADRlength = 20;
input Period = AggregationPeriod.DAY;
input showATR = yes;
input showAdrLabel = yes;
#calculate
def ADR = Average((high(period= Period)/low(period = Period)-1), ADRlength);
def ATR = MovingAverage( AverageType.WILDERS, TrueRange(high(period= Period), close(period = Period), low(period = Period)), ATRlength);
def DailyHigh = high(period = Period);
def DailyLow = low(period = Period);
def DR = DailyHigh - DailyLow; #current range
#ADR labels
def ADRrange = (DailyHigh/DailyLow-1);
def ATRDiff = roundUp(ATR-DR); #Range left
AddLabel(showATR, " ",color.black);
addlabel(showADRlabel,"ADR: "+aspercent(ADR),if ADR >=5/100 then color.green else color.GRAY);
AddLabel(showATR, "ATR: "+Round(DR,2)+ " / "+Round(ATR,1), (if DR >= ATR then Color.RED else Color.Green));
AddLabel(showATR and ATRDiff<0, "OVER!!!" , color.red);

###3. Risk Management System
## entry/Stop will be HOD and LOD
input ShowEnrtyAndStop = yes;
input ShowShares = yes;
input ShowEntryExitPercentOffset = 0.0; # .5%, you can use 0% for HOD/LOD
input RiskDollar = 100; #Dollar Risk
def Valid = getday()==GetlastDay();
plot Entry = if Valid then round(DailyHigh*(1+ShowEntryExitPercentOffset/100)) else double.NaN;
plot Stop = if Valid then round(DailyLow*(1-ShowEntryExitPercentOffset/100)) else double.NaN;
Entry.setDefaultColor(color.light_green);
Stop.setDefaultColor(color.light_RED);
AddLabel(ShowShares, " ",color.black);
AddLabel(ShowShares,"Shares= "+round(RiskDollar/DR,0),color.light_GRAY);
AddLabel(ShowEnrtyAndStop , " ",color.black);
AddLabel(ShowEnrtyAndStop ,"Entry= "+Entry,color.light_green);
AddLabel(ShowEnrtyAndStop ,"Stop= "+round(DailyLow),color.light_red);
Best of luck…
*** Disclaimer: for Education and Entertainment purpose only
thinkscripted by @yakBro yakbro.com 2021
This is great information. Thank you for taking the time to post this for us. I am typically a long swing trader. How would I customize these scripts to remove any of the bearish indicators? Just remove the plots for them? Thanks again!
yes
I know the time this took, thank you very much!
Thank you for the great stuff. There seems to be an error in the code for Swing Trading System with RM. When I copy the code into TOS study, there is a error flag on the line #trend
I would appreciate if you can look into this
it works fine