Here are some of my free tradingview scripts. you can customize or change it to fit your trading style.
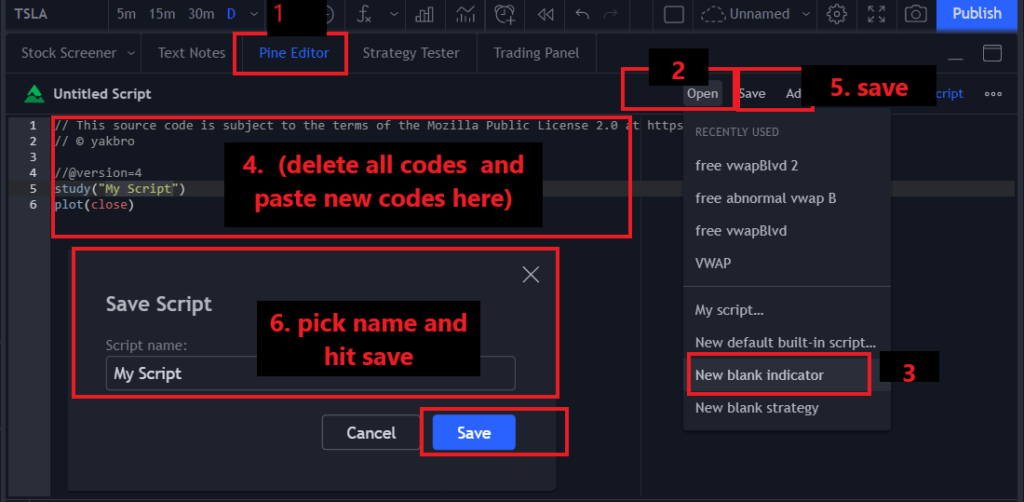
Direction to create new scripts
Pine Editior>open>New Blank Indicator>”delete and paste new scripts”>save>script name.

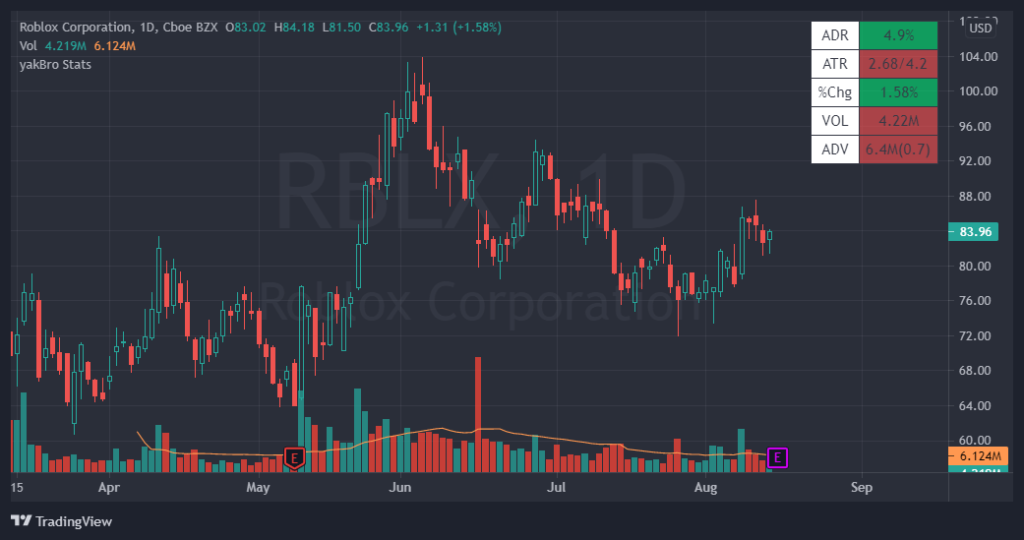
- Daily Stats (ADR / ATR / Vol, Rvol…)

// © yakbro.com 2021
//@version=4
study(title="yakBro stock health",shorttitle="yakBro Stats", overlay=true)

//inputs
adrlength = input(defval=20,title="ADR period",type=input.integer)
atrlength = input(defval=14,title="ATR period",type=input.integer)
advlength = input(defval=21,title="ADV period",type=input.integer)

var table t = table.new(position.top_right, 2, 5,frame_color=color.black,frame_width=1,border_color = color.black,border_width = 1)

//initialize
color up = input(color.lime, "Up")
color down = input(color.red, "Down")
autobgcolor = color.new(color.white,transp=0)

dr = security(syminfo.tickerid,"D",(high-low))
adr = security(syminfo.tickerid, 'D', sma((high/low-1)[1]*100,adrlength))
atr = security(syminfo.tickerid, 'D', atr(atrlength)[1])
change = security(syminfo.tickerid, 'D', (close/close[1]-1)*100)
//volume
vol = security(syminfo.tickerid, 'D', volume)
adv = security(syminfo.tickerid, 'D', sma(vol,advlength)[1])
rvol = vol/adv

if barstate.islast
    table.cell(t, 0, 0,"ADR",bgcolor = autobgcolor)
    table.cell(t, 0, 1,"ATR",bgcolor = autobgcolor)
    table.cell(t, 0, 2,"%Chg",bgcolor = autobgcolor)
    table.cell(t, 0, 3,"VOL",bgcolor= autobgcolor)
    table.cell(t, 0, 4,"ADV",bgcolor= autobgcolor)

    table.cell(t, 1, 0,tostring(round(adr[1],1))+"%",bgcolor = color.new(adr>=3 ? up : down,transp=40)) // if ADR >=3% >-> plots green else red
    table.cell(t, 1, 1,tostring(round(dr,2)) +"/"+ tostring(round(atr,1)),bgcolor = color.new(dr/atr>=1 ? up : down,transp=40))
    table.cell(t, 1, 2,tostring(round(change,2))+"%",bgcolor = color.new( change>=1?up:down,transp=40))
    table.cell(t, 1, 3,tostring(round(vol/1000000,2))+"M",bgcolor = color.new( rvol>=1?up:down,transp=40))
    table.cell(t, 1, 4,tostring(round(adv/1000000,1))+"M("+tostring(round(rvol,1))+")",bgcolor = color.new( rvol>=1?up:down,transp=40))
//end
2. 4% BreakOut UP/Down (purple is 9mil vol breakout)

//@version=4
// yakbro.com
study(title="yakBro Brekout", shorttitle="yakBro BO", overlay=false, resolution="")

minNum = input(defval = 4.0,title="Enter % Break Out Num.")

change = (close/close[1]-1)*100
validVolume = volume>=volume[1] and volume>100000

zerobase = plot(0,"Zerobase",color.black,transp=100,display=display.none,editable=false)

//4% BO/BD
boup = change>=minNum and validVolume ? 1 : 0
bupline = plot(boup,title="Breakout Green",style=plot.style_areabr,color=color.green,transp=50)

bodown = change<=-minNum and validVolume ? 1 : 0
bdownline = plot(bodown,title="Breakout Red",style=plot.style_areabr,color=color.red,transp=50)

//9mil volume break + 4% up or 4% down
nineMilVol =abs(change)>=4 and validVolume and volume>=9000000? 1 : na
nineMildollarLine = plot(nineMilVol,title="9mil vol BO",style=plot.style_columns,color=color.purple)
//end
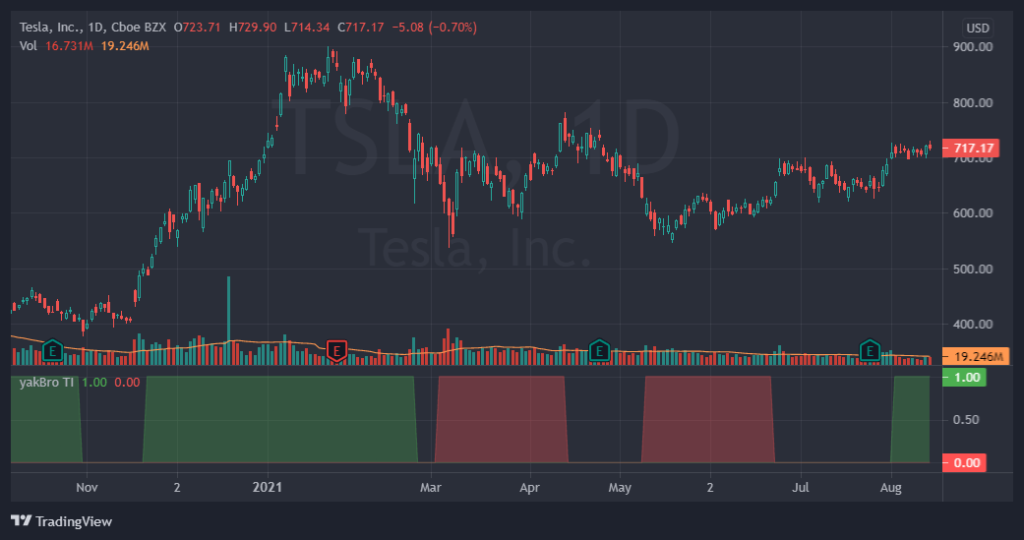
3. Trend Intensity (7/65)

//@version=4
// yakbro.com
study(title="yakBro Trend Intensity", shorttitle="yakBro TI", overlay=false, resolution="")

ma1 = input(defval = 7,title="fast sma")
ma2 = input(defval = 65,title="slow sma")

fastMA = sma(close,ma1)
slowMA = sma(close,ma2)

zerobase = plot(0,"Zerobase",color.black,editable=false,display=display.none)

boup = fastMA/slowMA-1 >=.05 ? 1 : 0
bupline = plot(boup,title="trending up",style=plot.style_areabr,color=color.green,transp=70)

bodown = fastMA/slowMA-1<=-.05  ? 1 : 0
bdownline = plot(bodown,title="treanding down",style=plot.style_areabr,color=color.red,transp=70)
//end
4. High Volume/PowerBar/PEG/Vwap Blvd (VWAP value can be slightly different from TOS vwap)

//@version=4
//yakbro.com
study(title="yakBro high Volume/VwapBlvd", shorttitle="yakBro vwapBLVD", overlay= true, resolution="D")

length = input(title="Look Back Period", type=input.integer, defval=50)
minVol = input(title="Required Min Volume(in Million)", type=input.integer, defval=4)

//initialize
checkVol = volume/1000000

// highiest volume
reset = volume == highest(volume,length) and checkVol>minVol

// horizontal line
var vline = 0.0
vline := reset ? vwap : vline[1]
oktoplot = vline == vline[1]
c = oktoplot and close > vline? color.green : color.red

vwapLineAcross = plot(vline,title="Highest Volume Vwap Line",color = oktoplot?c:na,trackprice=true,linewidth=2)
//end
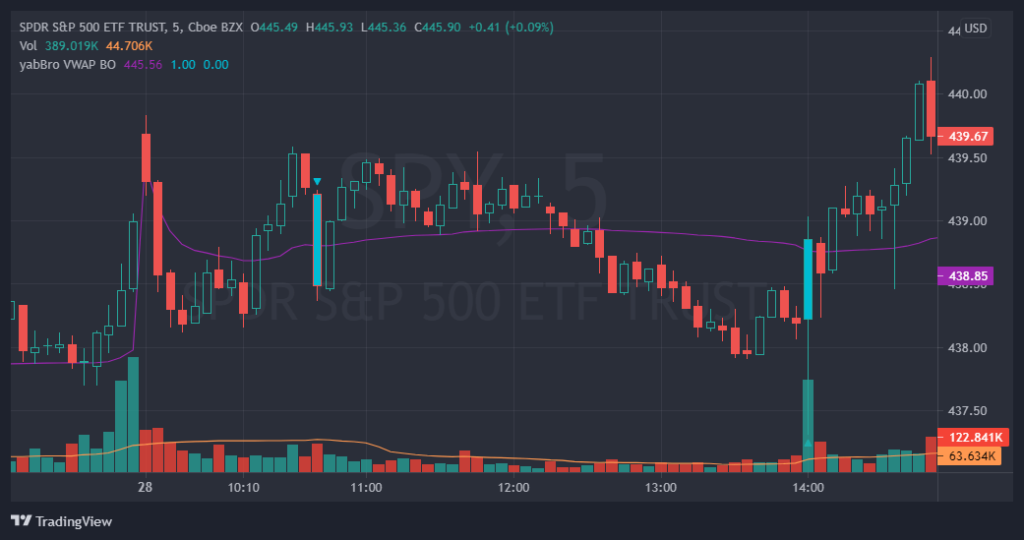
5. Abnormal Vwap Volume BO (*also includes alerts)

//@version=4
//yakbro.com
study(title = "yakBro Abnormal VWAP BO", shorttitle ="yabBro VWAP BO",overlay = true)

//values
avgValue = input (defval=10, title="Average Volume Period")
avgVolFac = input(defval=1.5,title="Rvol factor")
minVol = input(defval=50000,title="Required Minimum Volume")

//vwaps
P1 = plot(vwap, title="vwap", color=color.purple)

color bo = color.aqua
avgVol = sma(volume,avgValue)
volcheck = volume > avgVol*avgVolFac and volume>minVol and volume>volume[1]

vwapxUp = crossover(close,vwap) and volcheck
vwapxDown = crossunder(close,vwap) and volcheck

plotshape(vwapxUp, style=shape.triangleup,location=location.belowbar, color=bo)
plotshape(vwapxDown, style=shape.triangledown,location=location.abovebar, color=bo)
barcolor(vwapxUp or vwapxDown?bo:na,editable=false)

if (vwapxUp or vwapxDown)
    alert(message="Abnormal Volume VWap BO Detected!!",freq=alert.freq_once_per_bar_close)
//end
Best of Luck – yakBro

Thank you! very nice work!